2.2.3. Plotting data with matplotlib
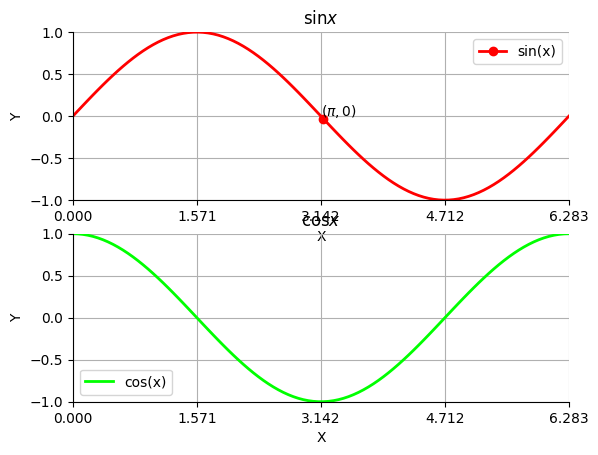
matplotlib is one of the simplest and popular plotting libraries for Python. The following example which produces the line plot shown below illustrates the basic functionality of matplotlib:
y0 = numpy.sin(x)
y1 = numpy.cos(x)
line0, = axes[0].plot(x, y0, label='sin(x)')
line1, = axes[1].plot(x, y1, label='cos(x)')

# set line color, style
line0.set_color((1, 0, 0))  # set color to red
line0.set_linewidth(2.)

line1.set_color((0, 1, 0))  # set color to green
line1.set_linewidth(2.)

# set axes limits
axes[0].set_xlim([0, numpy.pi * 2])
axes[0].set_ylim([-1, 1])

axes[1].set_xlim([0, numpy.pi * 2])
axes[1].set_ylim([-1, 1])

# set axes ticks
axes[0].set_xticks([0, numpy.pi / 2, numpy.pi, numpy.pi * 3 / 2, numpy.pi * 2])
axes[0].set_yticks([-1, -0.5, 0, 0.5, 1])

axes[1].set_xticks([0, numpy.pi / 2, numpy.pi, numpy.pi * 3 / 2, numpy.pi * 2])
axes[1].set_yticks([-1, -0.5, 0, 0.5, 1])

# add title and axis labels
axes[0].set_title(r'$\sin{x}$')
axes[0].set_xlabel('X')
axes[0].set_ylabel('Y')

axes[1].set_title(r'$\cos{x}$')
axes[1].set_xlabel('X')
axes[1].set_ylabel('Y')

# add annotations
line0.set_markevery([50])
line0.set_marker('o')
axes[0].text(numpy.pi, 0, r'$(\pi, 0)$')

# turn off axis border
axes[0].spines['top'].set_visible(False)
axes[0].spines['right'].set_visible(False)

axes[1].spines['top'].set_visible(False)
axes[1].spines['right'].set_visible(False)

# turn on grid
axes[0].grid(True)
axes[1].grid(True)

# add legend
axes[0].legend()
axes[1].legend()

# display figure
# fig.show()

# save figure
png_filename = os.path.join(os.path.dirname(__file__), '../../../docs/concepts_skills/software_engineering/matplotlib-example.png')
fig.savefig(png_filename, transparent=True, bbox_inches='tight')  # save in png format

pdf_filename = os.path.join(os.path.dirname(__file__), '../../../docs/concepts_skills/software_engineering/matplotlib-example.pdf')
fig.savefig(pdf_filename, transparent=True, bbox_inches='tight')  # save in pdf format

os.remove(pdf_filename)
2.2.3.1. Plot types
In addition to line plots, matplotlib provides functions to create a wide range of plots
bar: vertical bar plotbarh: horizontal bar ploterrorbar: plots lines with error barsfill: filled polygonshist: 1-D histogramhist2d: 2-D histogramscatter: scatter plot
See the matplotlib documentation for a complete list of the available plot types.